
Vous utilisez éventuellement le connecteur Microsoft Teams Call Quality Dashboard pour Power BI et si vous n'avez pas jamais essayé les modèles QER (quality of experience) avec Power BI, il est temps de découvrir la version 4.6 qui amène beaucoup de nouveautés ainsi que des informations très pertinentes pour les intégrateurs et les administrateurs d'environnement Microsoft Teams.
Vous pouvez télécharger QER en version 4.6 ici: https://www.microsoft.com/en-us/download/details.aspx?id=102291
Les nouveautés pour la version 4.6 sont les suivantes:
The following updates/issues were addressed in this version.
- New Call Health Details page allow for analysis of P2P calls.
- Home Page
- Redesigned for better visibility and navigation.
- Search
- Results now displayed for both meetings (CONF) and calls (P2P).
- Meeting and Call Results page filtered to only show calls > 60 seconds.
- User Feedback
New Top 10 reasons for poor feedback visual to help understand what is driving poor feedback ratings.
- New Total Surveys card that displays the total number of surveys over a seven-day period.
- Added to remove null values (no survey was presented) to reduce noise.
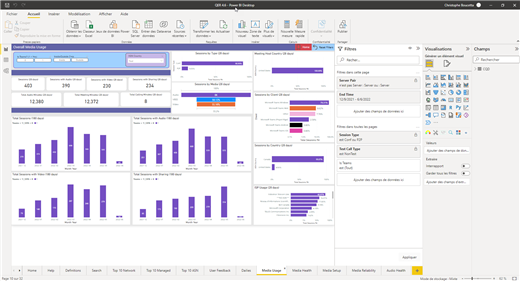
- Media Usage
- Renamed Usage page to Media Usage to better reflect overall intent.
- New Sessions by Client visual to display overall client usage. Duplicated in the Clients page as well.
- New Meeting Host Country visual. This visual outlines the country hosting the meeting.
- Media Health
- New Poor Freeze Rate tachometer.
- Media Setup
- Modified Setup Failure by Media Type instead of Transport. This is due to the lack of transport details provided when a call fails to setup.
- Updated page filters to remove MobileBB connections.
- Media Reliability
- New Networks with >5 roaming disconnects visual. This visual will display all the subnets that have reported 5 or more temporary roaming disconnects. This helps identify unstable networks that may be contributing to dropped calls.
- Removed Is Teams slicer and replaced with Wired/Wifi slicer
- Added filter to remove MobileBB connections
- Adjusted to Dropped Streams by Hour to show Total Stream count and is filtered for hours with Totals Streams > 1% to reduce the noise.
- Transport
- Updated TCP vs UDP visual to better display transport usage.
- Devices
- Updated Most Common microphones in use visual to only display dominant speaker microphones to better identify those active speaker’s devices. Report also keys off microphone type to allow for better grouping.
- Client
- Fixed Endpoint visuals to now properly display user UPNs along with additional measure to help track down and identify problem endpoints.
- Updated Client version saturation report to a waterfall stacked column chart to visualize the progress of a client update through the tenant.
- Added packet loss metrics to Endpoint Detected >5 Roaming Disconnects
- Added round trip metrics to Endpoint detected a network delay
- Meeting Health Details
- Added Meeting organizer
- Added User types to help identify the types of users in a meeting visually
- Added new filters to allow for easier analysis of XL meetings.
- Added full set of Meeting KHIs
- Max values are now properly named to reflect the data (jitter, packet loss, and latency).
- PSTN Health
- Updated PSTN health reports now display Operator Connect usage. Operator Connect usage is currently showing up as Unknown. We are working to address this as quickly as possible.
- Daily/Weekly Metrics
- New Host Region visual now displays the region where the meeting was hosted. This will allow for specific region analysis to ensure datacenter connectivity is optimal.
- Miscellaneous
- Added User Counts are now displayed in various graphs and tables to help analyze impact. You can now compare stream counts and user counts to better focus your remediation actions on areas with the highest user impact. You can view user counts by looking for the User Count measure and by hovering over charts and graphs to view the Tooltip.
- Added new filter to specific pages to display only streams where a full QoE packet was received.
- Added ASN Country slicer added to additional pages to allow for filtering a report by the ASN country.
- Added percentages based valued displayed alongside stream counts to help better understand overall usage and impact.
- Reduced the number of queries sent to CQD at one time by 50%. This reduction will reduce the number of visuals Power BI needs to draw at one time reducing the CPU overhead of Power BI on the workstation.
Les étapes d'installations sont les suivantes:
Prérequis: Power BI Desktop
1/ Installation CQD Connector
Il est nécessaire d'installer ou mettre a jour le CQD Connector
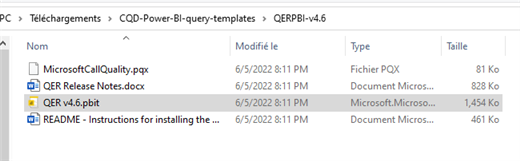
Naviguer vers le repertoire (ou créer le si non existant) [Documents]\Power BI Desktop\Custom Connectors
Copier le fichier MicrosoftCallQuality.pqx vers ce repertorie
Démarrer Power BI Desktop
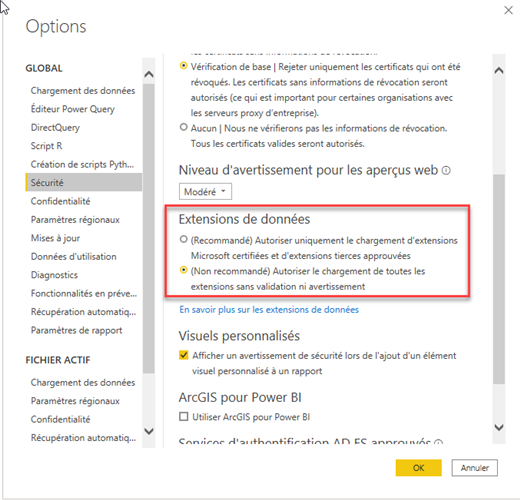
Naviguer dans les options de sécurité vers Select Fichier > Options et paramètres > Options > Securité
Sous "Extensions de données", sélectionner (Non recommandé) Autoriser le chargement de toutes les extensions sans validation ni avertissement
Redémarrer Power BI Desktop
2/ Publier les rapports QER
Prérequis, il est nécessaire de disposer de privileges permettant d'avoir accès au call analytics
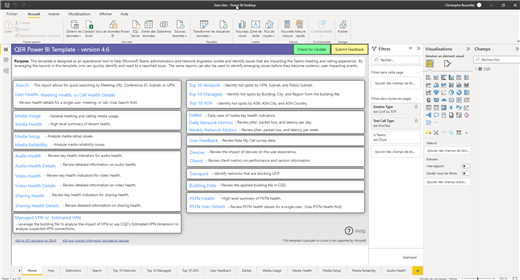
Lancer le fichier QER v4.6.pbit
Une fois connecté, l'interface d'acceuil est maintenant disponible
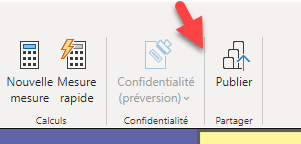
Publier les rapports vers votre espace personnel Power BI
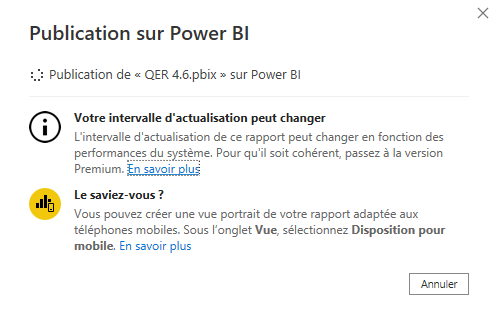
Une fois publié, vos rapports sont disponibles dans votre espace personnel